
Python SVG Library
2012/10/292012/11/15
2019/02/13
2023/06/22 library の更新
こう感じたのは、ブラウザが SVG の PDF 出力に対応しているのを発見した時である。Mac 環境では、Safari、 Chrome、Firefox が共にスケーラブルな PDF を出力する。Opera は残念ながら、PDF の中身はビットマップである。Windows 環境では Chrome が PDF 出力に対応し、内容はスケーラブルになっている。
Python/Tk の代わりに、SVG が使えるかも知れない...
このページは、Python 用の SVG ライブラリの開発の途中経過を示している。
調べてみると、結構多くの Python 用の SVG library が存在するようであるが... 僕の勉強を兼ねて...
2013/10/22 追記
いろいろ他の仕事があって、一年もの間、放置されていたが、そろそろライブラリを公開することとする。まだ十分に整理されていないので、まだ変化する部分はあると思うが...
Python SVG Library (lib.tar) base.py svg.py table.py
Python3 SVG Library (lib3.tar) base.py svg3.py table3.py
svg.py および svg3.py にバグが含まれていました。更新しました(2023-06-22)
Python の import 文で取り込めるには、PYTHONPATH にライブラリの置き場所を含める必要がある。
2019/02/13 追記
プログラムが苦手な人が世の中には多いらしい。そのためにマウスを使った会話的処理が好まれる傾向にある。エクセルは使えても R は知らないとか、...
図形を描くにも手作業でないと...
会話的作業は初心者には受けるのであろうが、ちゃんとした仕事をしたいなら、プログラムを使うべきであろう。でないと正確な図を描けない。
A basic Python SVG Library introduced here is written by me, and is not released yet.
But here are some examples that use the library.
This library is written in Python that should work on version 2.x.
(Python 3.x will be supported in near future. Change needs only a few lines)
Current library version is 0.3, and the code size is only 820 lines including many comments.
The library needs nothing except basic Python modules.
The library is written in the year 2012 but "under-construction" icon have been put to this page since that year. I think the specification will not be changed. So, the icon is removed.
POINTS is typically
X1,Y1,X2,Y2
POINT,POINT,...,POINT
[POINT,POINT,...,POINT]
POINT is one of
X,Y
(X,Y)
[x,y]
OPTS is
OPT,OPT,...,OPT
OPT isATTR=VALUE
ATTR is an attribute and VALUE is the value.
look https://www.w3.org/TR/SVG11/struct.html for details.
import svg
c = svg.Canvas(...)
.....
.....
c.close()
The usage is
svg.Canvas(X1,Y1,X2,Y2, OPTS)
X1,Y1,X2,Y2 are the coordinate of viewBox, and OPTS is a list of attribute value pairs. Note that the Canvas coordinate is same as that of SVG, namely, top left corner is the origin.
The special and useful attribute is map that is given as
map=(MX1,MY1,MX2,MY2)
MX1,MY1,MX2,MY2 defines a new coordinate system that allows users to use new coordinate system instead of original one.
Here is an example for the map option.
#!/usr/bin/env python3
# need: ebb lqr2.pdf, for latex
import svg3 as svg
mfont="MathJax_Math;size:8;style:normal;weight:normal"
tfont="Times;size:8;style:normal;weight:normal"
p,q=17,13
mx,my,sc = p,q,10
mg = 0.5 # margin
c = svg.Canvas(0,0,(1+2*mg+mx)*sc,(1+2*mg+my)*sc,map=(-1-mg,my+mg,mx+mg,-1-mg))
for k in range(0,p+1):
  c.line(k,0,k,my,stroke="black;width:0.5")
for k in range(0,q+1):
  c.line(0,k,mx,k,stroke="black;width:0.5")
c.text(0.7*mx,0,text="x",font=mfont,anchor="N",pad=0.3)
c.text(0,0.7*my,text="y",font=mfont,anchor="E",pad=0.3)
c.text(0,0,text="O",font=tfont,anchor="NE",pad=0.1)
c.text(mx/2,my/2,text="C",font=tfont,anchor="S",pad=0.3)
c.text(mx/2,0,text="M",font=tfont,anchor="N",pad=0.3)
c.text(0,my/2,text="N",font=tfont,anchor="E",pad=0.3)
c.line(0,0,mx,my,stroke="black;width:0.5;dasharray:3 1 1 1")
c.line(0,my/2,mx/2,my/2,stroke="black;width:0.5;dasharray:1 1")
c.line(mx/2,0,mx/2,my/2,stroke="black;width:0.5;dasharray:1 1")
c.circle(mx/2,my/2,r=0.1,fill="black")
c.close()
Note that this program is written in Python3
In this program, we have a line:
c = svg.Canvas(0,0,(1+2*mg+mx)*sc,(1+2*mg+my)*sc,map=(-1-mg,my+mg,mx+mg,-1-mg))
map=(-1-mg,my+mg,mx+mg,-1-mg)
This mapping is used for having margin space and labeling space.
Other attribute value pairs give default values to the canvas. These values are strings of standard string values of SVG attributes. For example
font="family:Helvetica;size:16"
stroke="red;width:3"
Some attributes are special to the SVG library.
For example a simpler form for font may be written as:
font="Helvetica;size:16"
map is a tuple, not a string.
c.close()foo.svg" assuming "foo.py" is a file name in which c.close() is executed.c.close(save=None)c.close(save="bar.svg")bar.svg"
The code in svg library listed below shows the usage for grid( ):
    """=== usage example
	c.grid(1,1,range=(-1.3,1.3,1.3,-1.3),stroke="cyan",
	frame="green;width:5",axis="black;width:2",
	font="Helvetica;size:16",label=("X","Y"))
      # note that font is for the scale numbers, not for the axis label
      # it's unable to make fine tuning to label. if you need, do manually!
      # making too much is worse than do nothing.
    ==="""
#encoding: utf-8
import svg
c = svg.Canvas(0,0,800,600,map=(-400,-300,400,300))
h = c.clip(id="C",clip="rule:nonezero")
h.circle(0,0,r=200)
c.image(-400,-300,400,300,clip="path:url(#C)",href="bird.jpg")
c.close()
You need a image file "bird.jpg" in the current directory, or change the name to something else you have.
In the followings, c is a canvas instance.
The group family creates a new canvas instance.
g = c.group(OPTS)
g = c.define(OPTS)
g = c.mask(OPTS)
g = c.clip(OPTS)
usually
c.text(POINT,text=TEXT,OPTS)
c.text(text=TEXT,ref=REF,OPTS)
line() draws a line or polyline. the usage is,
c.line(POINT,POINT,OPTS)
For a polyline,
c.line(POINTS,OPTS)
OPTS for line() method is
linecap:
stroke="linecap:SHAPE"
SHAPE is one ofbutt, round, square
linejoin:
stroke="linejoin:SHAPE"
SHAPE ismiter, round, bevel
c.rect(POINT,POINT,OPTS)
c.polygon(POINTS,OPTS)
for circle of radius R
c.circle(POINT,r=R,OPTS)
c.circle(POINT,r=(RX,RY),OPTS)
RX and RY are the two radius (for X-axis and Y-axis respectively).
c.arc(POINT,start=START,extent=EXTENT,OPTS)
c.image(POINT,POINT,OPTS)
c.path(PATH,OPTS)
<path d=PATH>
Conventional aliases of SVG atributes
library		SVG
font  		font-family
href  		xlink:href
ref="FOO" xlink:href="#FOO"
Some of SVG Specifications are not supported yet.
xml:base
xml:lang
xml:space
All group families have an output buffer.
Contents in the buffer (including all it's children's buffer) are flushed to the parent output buffer by 'end()' method.
The 'close()' method is a special 'end()' method, that can act only to the root group (i.e., Canvas).
次の SVG 画像について考えてみる。
図1は、uniform B-spline 曲線がコントロールポイント(赤丸で示されている)によってどのように決まっているのかを示している。
この例に見られるように、図を書く時には、点の説明等に数式の変数名が要求される場合がある。この図が LaTeX の中で使われるならば、LaTeX のスタイルに合わせる必要があろう。
変数名程度であれば、簡単にやっていける。このケースでは
def tex2svg(s):
  t = s.split("_")
  return t[0] + '<tspan dy="0.2em" font-size="80%">'+ t[1] + "</tspan>"
で TeX の下付き文字を SVG 形式に変換する関数を(極めてなまくらなやり方で)定義しておいて
label=[]
for n in range(0,len(P)):
  label.append(tex2svg("P_%s"%n))
c.mark(P,ref=sym,label=label,pad=0.3,anchor="SW",decoration=True)
label=[]
for n in range(0,len(Q)):
  label.append(tex2svg("Q_%s"%n))
c.mark(Q,ref=sym2,label=label,pad=0.3,anchor="NE",decoration=True)
とやっているだけである。
もちろん、tex2svg は汎用性を持っていない。このケースに即した極めて限定的、便宜的なものである。しかし、こうした限定性を超えた時の代償は極めて大きい。 TeX の数式の解析ルーチンの他に、文字毎に高さや横幅の詳細な情報が必要になろう。実際のニーズの程度に比べると、払う代償は大きすぎる。
SVG ファイルから PDF ファイルを生成するのに使えそうなツールについて整理してみた。
以下の情報は2013年1月での現状に基づいている。
一番簡単な方法である。そして、この方法がベストだと思う。
ブラウザの印刷メニューの中の PDF 出力を使う。
通常、ブラウザはヘッダやフッタもプリントするので、これを外す。次の図2はSafari の例である。
図2: Safari のプリントオプション
欠点は、コマンドではやれない事である。しかし、大量の SVG ファイルを処理するニーズが存在しない限り、この事は問題にはならない。
Latex などで使うときにはトリミングが必要になる。(「LaTeX への取り込み」を見よ)
PDF 変換にコマンドツールを使えるらしいが、"ReportLab package" が要求される。この方法は、大量の SVG をリアルタイムで PDF に変換するサーバ向けの方法である。
[1] svglib 0.6.3
http://pypi.python.org/pypi/svglib/
[2] ReportLab
http://www.reportlab.com/
Python でチャートを描く事を目標としているライブラリである注1。
このライブラリの特徴は、TeX 数式のサポートが行われている事であろう。TeX のパーサを持っている。
注1: この点では、僕の方向性 -- SVG を Python から使いやすくする -- と異なっている。
[3] svgplotlib 0.2
http://pypi.python.org/pypi/svgplotlib/
Adobe Illustrator は MathJax_Math をインストールしてあっても、(最初にロードした時点では) Ariel フォントを使ってしまう。手作業でフォントを MathJax_Math に切り替える必要がある。
Inkscape(0.48.2)は MathJax_Math を認識してはいるが、文字の出力位置の微調整を行っている dx, dy を認識していない。そのために文字位置がずれる。その様子を図3に示す。正しくは図1ようにならなくてはならない。
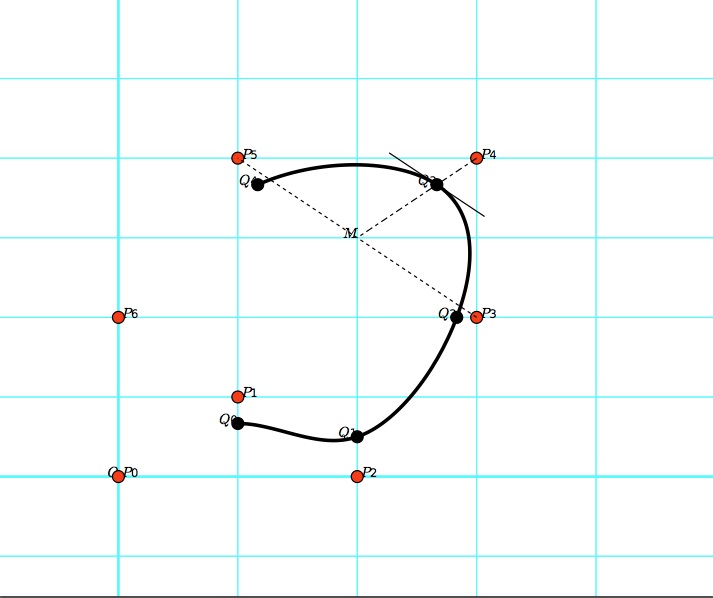
図3: Inkscape は文字位置の調整にバグがある
Inkscape の PDF 保存は、余計な空白が入らないので使いやすい。それだけに、残念である。文字位置の決定は dx, dy 無しでもやれるが、Inkscape のためにわざわざプログラムを変更する気にはなれない。
OSX 10.8 (Mountain Lion) では Inkscape が動く為には XQuartz が必要である([4,5])。
[4] About X11 and OS X Mountain Lion
http://support.apple.com/kb/HT5293
[5] XQuartz
http://xquartz.macosforge.org/landing/
Inkscape(version 0.48 以上) の出力オプションに「LaTex with PSTrick macro」がある。このオプションは、LaTeX の中に、Inkscape で作った PDF ファイルを取り込む時に、TeX の数式を PDF 画像に重ねる事を意図している。Inkscape の中で、LaTeX で表現したい部分を $\frac23$ のように $ で括ると、出力される PDF ファイルからはその部分は除去され、代わりに、式を表示するだけを目的とした LaTeX のテキストが併せて生成される。つまり数式を含まない PDF ファイルと、数式だけを含む小さな LaTeX ファイルの共同によって、LaTeX の中に数式を含む図形を実現しようとする。
この方法は、数式表現に LaTeX そのものを使うので極めて強力なのであるが、重大な欠陥を持っている。2つのファイルに分かれている為に、図形を取り込む LaTeX 文書の中で、図形のサイズ調整がままならない。
SVG ファイルは直接 LaTeX には取り込めない。ブラウザを使って PDF に変換すると余計な空白が発生する。そのためにトリミングが必要になる。この例では次のようにトリミングした。
\begin{figure}[h]
\begin{center}
\scalebox{0.5}{\includegraphics[trim=4cm 5cm 3cm 10cm, clip=true]{bspline1c.pdf}}
\end{center}
\end{figure}
http://pypi.python.org/pypi/svgplotlib/http://mensch.org/simpleSVG/http://codeboje.de/pysvg/http://codeboje.de/downloads/pySVG_Tutorial.pdfhttp://pypi.python.org/pypi/svgwrite/http://pygal.org/
http://florian-berger.de/en/articles/creating-simple-svg-from-python